Facts&Figures
Empa is aiming for climate neutrality by 2030. The countdown has begun...
The most important facts in brief
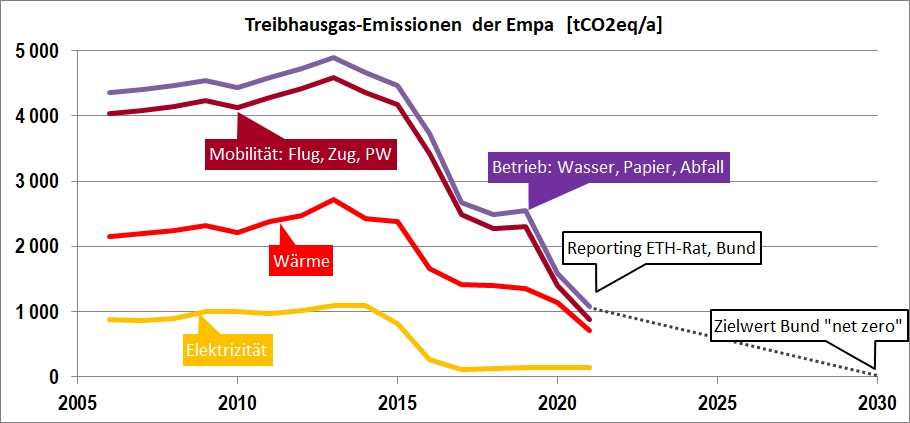
Trend of greenhousegas-emissions 2006 - 2021:

Details, example 2018:
Electricity (total demand 2018: 11.2 million kWh)
- Generated by 100% from renewable sources since 2016, mainly run-of-river power station Eglisau (proof of origin).
- Since 1996 approx. 30'000 kWh/a from one of the first façade-integrated PV systems in Switzerland at Empa St. Gallen, expansion in 2016 to approx. 100'000 kWh/a.
- Since 2017, PV production in Dübendorf has been greatly expanded, partly using PV cells from the company's own research.
- In total, an expansion to over 600,000 kWh of electricity from solar energy is planned by 2030.
Heat (total demand 2018: 6.2 million kWh)
- St. Gallen: Utilisation of district heating from waste incineration plant (approx. 700,000 kWh) and waste heat from cooling plants.
- Dübendorf: Natural gas (approx. 4.6 million kWh) and biogas (approx. 800'000 kWh proof of origin) with planned expansion of the share of biogas thanks to income from internal CO2 compensation for business flights.
- Under construction: An energy grid in Dübendorf allows heat/cold exchange on campus. Combined with optimised buildings and processes, this leads to significantly lower energy requirements.
- Planned: Use of heat pumps to generate high temperatures from the medium temperature network (gas will become obsolete).
- Planned: Large heat storage tanks connected to the energy network to shift heat energy into the cold season.
Mobility
Approx. 2.9 million km for business flights (approx. 0.8 million km short-haul, 2.1 million km long-haul). Since 2020: Internal CO2 tax mandatory (CHF 96.-/km) in favour of substitution of natural gas by biogas.
Approx. 1.0 million km by rail for business trips.
Approx. 0.46 million km by car for business trips.
Approx. 6.1 million km for commuting by rail (survey May 2018)
Approx. 2.8 million km for commuting by car (survey May 2018).
Plus...
- 11'000 kg paper for printers and copiers (approx. 99% recycled paper)
- 250'000 kg waste
- 22'000 kg water
Empa tachometer: How is Empa on track?
The summary of the relevant material and energy flows and the assessment of these flows in terms of greenhouse gases (IPCC 2013 100a method) gives the following picture:
Greenhouse gas emissions in the reported areas:

-
Share
