Data-driven agriculture
YourVCCA Launches Interactive Map to Identify Cold Room Locations
The growth in the global demand for food has driven farmers to pick up data-driven tools in tandem with their traditional farming equipment. By doing so, they hope to increase their future yields and profits. However, the rising tide of information has only had limited influence over the decision-making behavior of farmers and other stakeholders in the agricultural supply chain.

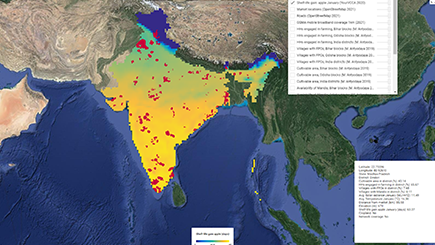
This gap between availability and usage arises because different datasets needed to translate numbers into action often fail to interact with one another and can be challenging to visualize and understand. Fresh food supply chains are complex systems comprising diverse individuals, organizations, resources, activities and technologies, and the previous problems arise within a variety of actors looking to leverage data-driven decision making. Even when focusing on a smaller section of the supply chain, i.e., cold storage, a range of factors such as access to roads and the electrical grid, proximity to mandis (big markets), number of households engaged in farming have to be factored for successful decision-making by supply chain stakeholders (farmers, cold storage providers, retailers, and policymakers). Using widely available open-source agricultural data from different domains, the BASE and Empa teams have developed a multi-layer, interactive map of India to help players along the fresh food supply chain in decision-making.
India’s hinterlands are home to nearly two-thirds of the population, of which 70 percent rely on agriculture for their livelihoods. A large majority of these farmers operate on less than two hectares of land, making it crucial for them to maximize the sale of their produce for sustenance. However, the reality is far from the ideal – nationally, farmers lose out on revenue from the post-harvest spoilage of about 20-30 percent of their produce. The Your Virtual Cold Chain Assistant (YourVCCA) project being implemented by BASE and Empa aims to reduce food loss by expanding access to pay-per-use cooling services as well as by developing an app that digitizes inventory management and provides pre- and post-harvest market intelligence for proper handling, storage, and protection of the crops. "We have created an accessible tool to dynamically compare multiple locations across India," says Roberta Evangelista, Sustainability Data Science and Digitalization Specialist at BASE. "Our goal is to empower cold chain providers to make the best decisions for their business and the farmers they are serving."
Organizing Open-Source Data in a single Map

There have been several prior initiatives in India to combat the lack of data in rural areas in India. However, many available data are not easy to access or visualize, and may require a certain degree of processing before they can be turned into interpretable information for decision-making. One such notable example is Mission Antyodaya, launched in 2017 by the Indian Government to collect data at the village level on, inter alia, agriculture, land improvement, infrastructure development, rural electrification, and growth in non-conventional energy sources. Although digitally recorded, this open-source data is scattered and needs to be processed into geospatial format and analyzed to maximize its utility. The interactive web map developed by BASE and Empa as a Google Earth Engine application offers one such synthesis by collating and visualizing different raster and vector data layers related to India’s fresh produce supply chain. Relevant spatially distributed data on cropland mask, elevation, predicted electricity network lines, crop production of fruits and vegetables, temperature, solar radiance, roads, availability of markets, households engaged in farming, distribution of farmer producers’ organizations, and mobile band coverage have been visualized at a district level (or block-level, for some states) through this one-of-a-kind map.
What purpose does the map serve?
This visual representation of the selected data layers serves as a decision-making tool for stakeholders form the public and private sector in the fresh produce supply chain, including social enterprises like farmer producer organizations and policymakers, as well as financial institutions, cooling providers, NGOs, and government bodies. “Our mission is aligned with the targets of the SDG 2, and is to improve the income of small-scale farmers around the world with the benefits and opportunities that cooling brings. We believe that the open-source tool we have developed is a key step in that direction, allowing cooling service providers to unlock geospatial insights when looking to scale their cooling rooms offering,” says Joaquin Gajardo, Data Scientist and Software Developer at Empa’s SimBioSys group.
A practical example of this is identifying where cooling could provide the highest shelf life gains and where to site future cold storage facilities. Cold storage rooms can add value to farming products, thereby witnessing an increasing demand nationwide. However, these cold rooms can adequately benefit farmers only when they are conveniently placed and meet all criteria to protect the crops. The deliberations of where to place a cold room depend on several factors, which may vary by state. Identifying promising cooling unit locations demands expert guidance and technical know-how, which due to the infancy and nicheness of the cooling industry in India, may be difficult to find. The map simplifies this process for cold room operators by computing ideal locations within a 20 km market radius, at most 500 m away from the road, with stable network coverage, and other state-wise considerations. This is the first step towards an application where users are able to compute promising cold room locations by dynamically deciding which layers to include and their thresholds.
Furthermore, cold storage can increase the number of days farmers take to secure profitable sales for their crops instead of liquidating their crops at low rates before it spoils. The map represents the shelf-life gain for selected crops (potatoes, apples, and bananas) in different states. These calculations offer farmers and cold storage operators critical information on the added benefit of using (respectively, offering) cold storage with an actionable metric: the number of shelf life days gained by storing fruits and vegetables in a cold room vs at ambient temperature.
The learnings from this map will be complemented by an easy-to-use YourVCCA app to help cold room operators digitally check-in and check-out crates brought in by the farmers, indicate the number of remaining shelf-life days, and provide market intelligence. Stay tuned for the release of the app's first version in April 2022.
Prof. Dr. Thijs Defraeye
Biomimetic Membranes and Textiles
Phone +41 58 765 47 90
Thijs.Defraeye@empa.ch
BASE website
Interactive map of India
K Shoji, R Evangelista, J Gajardo, T Motmans, T Defraeye; Increasing accessibility and usability of open-source data through a web map for better decision-making in India's cold chain of fresh produce (2022); doi: 10.5281/zenodo.5839900
-
Share


